B3 (short for Buildings, Benchmarks & Beyond) is a statewide tool that collects energy and water data for public buildings in Minnesota. The program is managed by the State of Minnesota and funded through the Minnesota Department of Commerce.
City Facilities Energy Benchmarking
The City of Rochester uses the Minnesota B3 Benchmarking program to track energy and water use across its public buildings. This tool helps us monitor building performance over time, identify opportunities for improvement, and support decisions that make our buildings healthier and more efficient.
Currently, 32 of City-owned buildings in Rochester are actively reporting data quarterly through B3 Benchmarking. These include libraries, fire stations, office buildings and more.
Additional Information:
For each building, B3 tracks:
- Electricity and natural gas use
- Water consumption
- Energy use intensity (EUI) — how much energy a building uses per square foot
- Performance compared to similar buildings
View Rochester's Building Performance
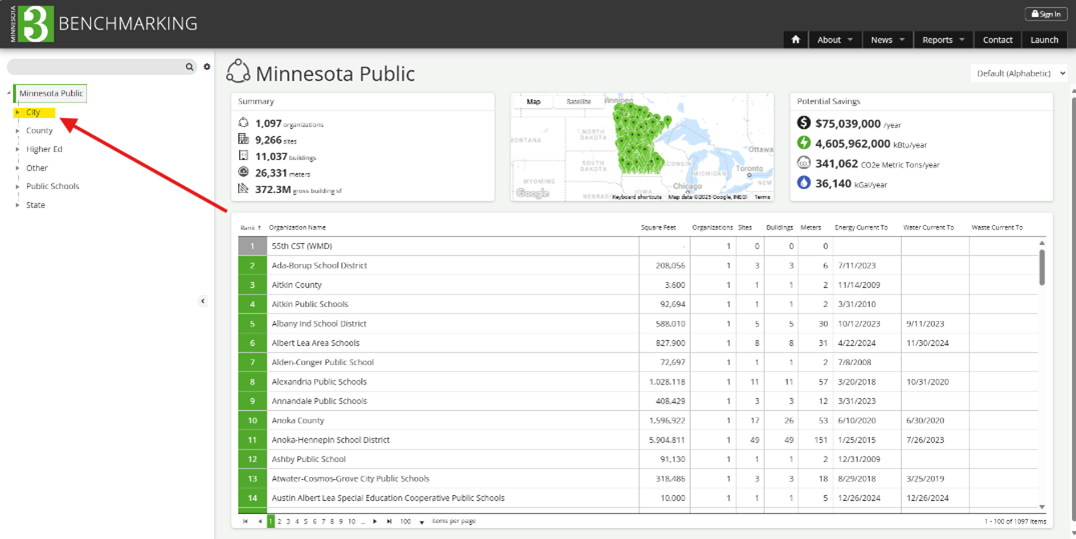
You can explore building-level performance using the B3 Public Dashboard. Here's how:
- Visit the B3 Public Dashboard
- Select "City" as the owner type, on the left side of the screen:
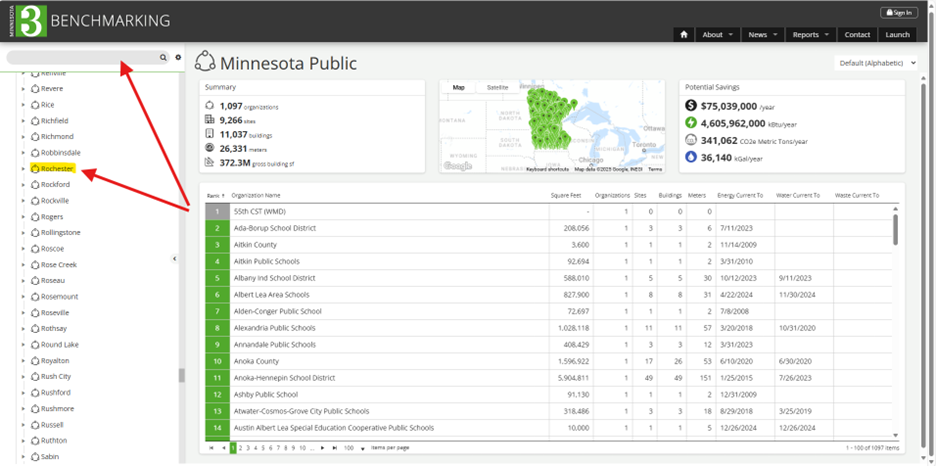
- Scroll to choose "Rochester" from the list or use the search bar and type in "Rochester."
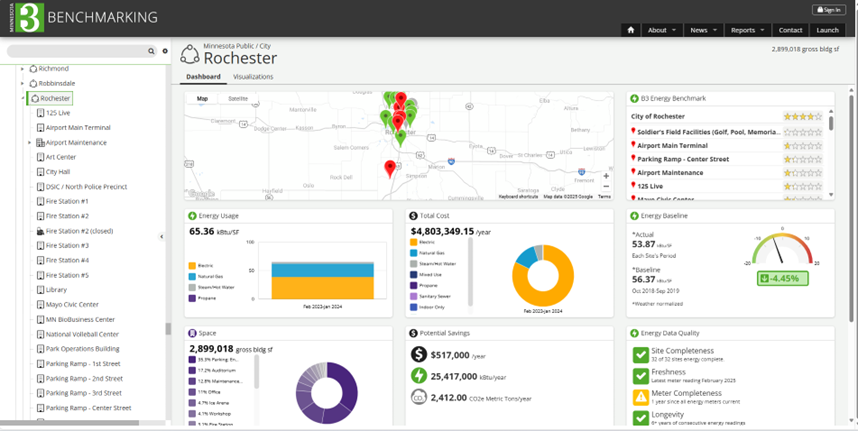
- Click on individual buildings to see graphs of energy use, water use and emissions.
Here are a few example screenshots from the B3 Dashboard, with tips on how to interpret the data:
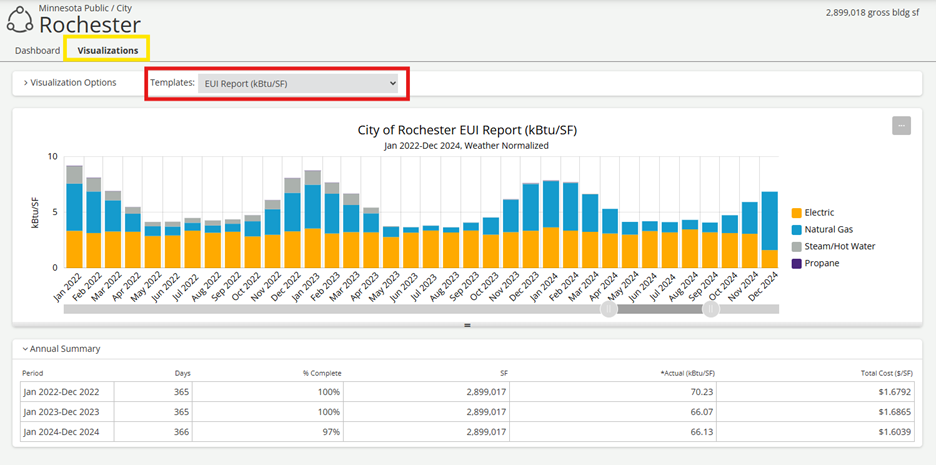
Screenshot: City of Rochester Energy Use Year Over Year
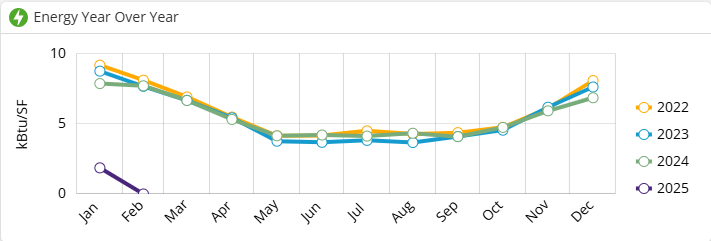
This chart shows the City of Rochester use of energy year over year.
*When the graph goes to zero in the current year, that means City Staff is working on adding data in that month.
Screenshot: Building Comparison - Example: Development Services Infrastructure Center and the North Police Precinct
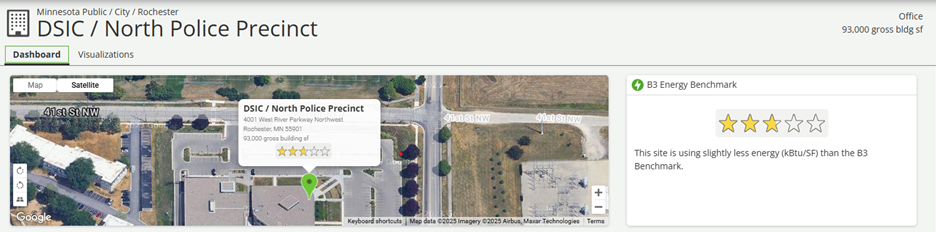
This section shows how Rochester buildings compare to other similar buildings across the state. A green score means it's performing better than average. The Development Services Infrastructure Center and the North Police Precinct in this example use slightly less energy than the average B3 building.
Screenshot: Greenhouse Gas Emissions
When looking at the City of Rochester as a whole or a specific building, you can go to the visualization tables and see specific visualization templates. The example above is the annual emissions from City facilities.
Connect with City Services
Whether you have a question, need to report a concern or aren’t sure which department to contact, 311 connects you with the right team quickly and efficiently.